Correlation analysis across preprocessing tools#
Requires
Generated by alevin_coll_decoy_gtr_vi.ipynb
DATA_DIR/pfc/velocities/alevin_coll_decoy_gtr_velovi.npy
Generated by alevin_coll_decoy_gtr_em_ss.ipynb
DATA_DIR/pfc/velocities/alevin_coll_decoy_gtr_em.pickleDATA_DIR/pfc/velocities/alevin_coll_decoy_gtr_steady_state.pickle
Generated by alevin_coll_gtr_vi.ipynb
DATA_DIR/pfc/velocities/alevin_coll_gtr_velovi.npy
Generated by alevin_coll_gtr_em_ss.ipynb
DATA_DIR/pfc/velocities/alevin_coll_gtr_em.pickleDATA_DIR/pfc/velocities/alevin_coll_gtr_steady_state.pickle
Generated by alevin_sep_decoy_gtr_vi.ipynb
DATA_DIR/pfc/velocities/alevin_sep_decoy_gtr_velovi.npy
Generated by alevin_sep_decoy_gtr_em_ss.ipynb
DATA_DIR/pfc/velocities/alevin_sep_decoy_gtr_em.pickleDATA_DIR/pfc/velocities/alevin_sep_decoy_gtr_steady_state.pickle
Generated by alevin_sep_gtr_vi.ipynb
DATA_DIR/pfc/velocities/alevin_sep_gtr_velovi.npy
Generated by alevin_sep_gtr_em_ss.ipynb
DATA_DIR/pfc/velocities/alevin_sep_gtr_em.pickleDATA_DIR/pfc/velocities/alevin_sep_gtr_steady_state.pickle
Generated by alevin_spliced_unspliced_gtr_vi.ipynb
DATA_DIR/pfc/velocities/alevin_spliced_unspliced_velovi.npy
Generated by alevin_spliced_unspliced_gtr_em_ss.ipynb
DATA_DIR/pfc/velocities/alevin_spliced_unspliced_em.pickleDATA_DIR/pfc/velocities/alevin_spliced_unspliced_steady_state.pickle
Generated by kallisto_dropest_vi.ipynb
DATA_DIR/pfc/velocities/dropest_velovi.npy
Generated by kallisto_dropest_em_ss.ipynb
DATA_DIR/pfc/velocities/dropest_em.pickleDATA_DIR/pfc/velocities/dropest_steady_state.pickle
Generated by isocollapse_exclude_vi.ipynb
DATA_DIR/pfc/velocities/kallisto_isocollapse_exclude_velovi.npy
Generated by isocollapse_exclude_em_ss.ipynb
DATA_DIR/pfc/velocities/kallisto_isocollapse_exclude_em.pickleDATA_DIR/pfc/velocities/kallisto_isocollapse_exclude_steady_state.pickle
Generated by kallisto_isocollapse_include_vi.ipynb
DATA_DIR/pfc/velocities/kallisto_isocollapse_include_velovi.npy
Generated by kallisto_isocollapse_include_em_ss.ipynb
DATA_DIR/pfc/velocities/kallisto_isocollapse_include_em.pickleDATA_DIR/pfc/velocities/kallisto_isocollapse_include_steady_state.pickle
Generated by kallisto_isoseparate_exclude_vi.ipynb
DATA_DIR/pfc/velocities/kallisto_isoseparate_exclude_velovi.npy
Generated by kallisto_isoseparate_exclude_em_ss.ipynb
DATA_DIR/pfc/velocities/kallisto_isoseparate_exclude_em.pickleDATA_DIR/pfc/velocities/kallisto_isoseparate_exclude_steady_state.pickle
Generated by starsolo_subtr_vi.ipynb
DATA_DIR/pfc/velocities/starsolo_subtr_velovi.npy
Generated by starsolo_subtr_em_ss.ipynb
DATA_DIR/pfc/velocities/starsolo_subtr_em.pickleDATA_DIR/pfc/velocities/starsolo_subtr_steady_state.pickle
Generated by starsolo_vi.ipynb
DATA_DIR/pfc/velocities/starsolo_velovi.npy
Generated by starsolo_em_ss.ipynb
DATA_DIR/pfc/velocities/starsolo_em.pickleDATA_DIR/pfc/velocities/starsolo_steady_state.pickle
Generated by velocyto_vi.ipynb
DATA_DIR/pfc/velocities/velocyto_velovi.npy
Generated by velocyto_em_ss.ipynb
DATA_DIR/pfc/velocities/velocyto_em.pickleDATA_DIR/pfc/velocities/velocyto_steady_state.pickle
Output
Library imports#
import os
import sys
from tqdm import tqdm

import matplotlib.pyplot as plt
import seaborn as sns
import mplscience

import numpy as np
import pandas as pd
from scipy.stats import pearsonr

sys.path.insert(0, "../../../")
from paths import DATA_DIR, FIG_DIR
General settings#
sns.reset_defaults()
sns.reset_orig()
Constants#
PROTOCOLS = [
    'alevin_coll_decoy_gtr',
    'alevin_coll_gtr',
    'alevin_sep_decoy_gtr',
    'alevin_sep_gtr',
    'alevin_spliced_unspliced',
    'dropest',
    'kallisto_isocollapse_exclude',
    'kallisto_isocollapse_include',
    'kallisto_isoseparate_exclude',
    'kallisto_isoseparate_include',
    'starsolo_subtr',
    'starsolo',
    'velocyto'
]
SAVE_FIGURES = True
if SAVE_FIGURES:
    os.makedirs(FIG_DIR / 'comparison', exist_ok=True)
Data loading#
velocities_velovi = {
    protocol: np.load(file=DATA_DIR / 'pfc' / 'velocities' / f'{protocol}_velovi.npy')
    for protocol in PROTOCOLS
}
velocities_em = {protocol: pd.read_pickle(DATA_DIR / 'pfc' / 'velocities' / f'{protocol}_em.pickle') for protocol in PROTOCOLS}
velocities_steady_state = {protocol: pd.read_pickle(DATA_DIR / 'pfc' / 'velocities' / f'{protocol}_steady_state.pickle') for protocol in PROTOCOLS}
N_OBS = velocities_velovi['alevin_coll_decoy_gtr'].shape[0]
_var_names = velocities_em[PROTOCOLS[0]].columns[~velocities_em[PROTOCOLS[0]].isnull().any()]

for protocol in PROTOCOLS[1:]:
    _var_names = _var_names.intersection(velocities_em[protocol].columns[~velocities_em[protocol].isnull().any()])

_var_names_idx = np.where(velocities_em[protocol].columns.isin(_var_names))[0]
for protocol in tqdm(PROTOCOLS):
    velocities_em[protocol] = velocities_em[protocol][_var_names]
    velocities_steady_state[protocol] = velocities_steady_state[protocol][_var_names]
    velocities_velovi[protocol] = velocities_velovi[protocol][:, _var_names_idx]
100%|██████████| 13/13 [00:00<00:00, 69.92it/s]
corr_velovi = {
    PROTOCOLS[protocol_id]: pd.DataFrame(columns=PROTOCOLS[protocol_id + 1:]) for protocol_id in range(len(PROTOCOLS))
}
corr_em = {
    PROTOCOLS[protocol_id]: pd.DataFrame(columns=PROTOCOLS[protocol_id + 1:]) for protocol_id in range(len(PROTOCOLS))
}
corr_steady_state = {
    PROTOCOLS[protocol_id]: pd.DataFrame(columns=PROTOCOLS[protocol_id + 1:]) for protocol_id in range(len(PROTOCOLS))
}
for ref_protocol in tqdm(PROTOCOLS):
    for protocol in corr_velovi[ref_protocol]:
        # velovi
        corr_velovi[ref_protocol][protocol] = np.array(
            [
                pearsonr(
                    velocities_velovi[ref_protocol][row_id, :],
                    velocities_velovi[protocol][row_id, :]
                )[0]
                for row_id in range(N_OBS)
            ]
        )

        # em
        corr_em[ref_protocol][protocol] = np.array(
            [
                pearsonr(
                    velocities_em[ref_protocol].values[row_id, :],
                    velocities_em[protocol].values[row_id, :]
                )[0]
                for row_id in range(N_OBS)
            ]
        )
        # vanilla steady state
        corr_steady_state[ref_protocol][protocol] = np.array(
            [
                pearsonr(
                    velocities_steady_state[ref_protocol].values[row_id, :],
                    velocities_steady_state[protocol].values[row_id, :]
                )[0]
                for row_id in range(N_OBS)
            ]
        )
100%|██████████| 13/13 [00:27<00:00, 2.15s/it]
Correlation plots#
combined_corr = {}
alevin_coll_decoy_gtr#
df_velovi = corr_velovi[PROTOCOLS[0]]
df_velovi["Method"] = 'VI'

df_em = corr_em[PROTOCOLS[0]]
df_em["Method"] = 'EM'

df_steady_state = corr_steady_state[PROTOCOLS[0]]
df_steady_state["Method"] = 'Steady-state'

combined_corr[PROTOCOLS[0]] = pd.concat([df_velovi, df_em, df_steady_state])

fig, ax = plt.subplots(ncols=combined_corr[PROTOCOLS[0]].shape[1] - 1, figsize=((combined_corr[PROTOCOLS[0]].shape[1] - 1) * 6, 4))
for col_id, col in enumerate(combined_corr[PROTOCOLS[0]].columns[:-1]):
    sns.boxplot(x="Method", y=col, data=combined_corr[PROTOCOLS[0]], palette='colorblind', ax=ax[col_id])
    ax[col_id].set_xticklabels(ax[col_id].get_xticklabels(), rotation=45)

alevin_coll_gtr#
df_velovi = corr_velovi[PROTOCOLS[1]]
df_velovi["Method"] = 'VI'

df_em = corr_em[PROTOCOLS[1]]
df_em["Method"] = 'EM'

df_steady_state = corr_steady_state[PROTOCOLS[1]]
df_steady_state["Method"] = 'Steady-state'

combined_corr[PROTOCOLS[1]] = pd.concat([df_velovi, df_em, df_steady_state])

fig, ax = plt.subplots(ncols=combined_corr[PROTOCOLS[1]].shape[1] - 1, figsize=((combined_corr[PROTOCOLS[1]].shape[1] - 1) * 6, 4))
for col_id, col in enumerate(combined_corr[PROTOCOLS[1]].columns[:-1]):
    sns.boxplot(x="Method", y=col, data=combined_corr[PROTOCOLS[1]], palette='colorblind', ax=ax[col_id])
    ax[col_id].set_xticklabels(ax[col_id].get_xticklabels(), rotation=45)

alevin_sep_decoy_gtr#
df_velovi = corr_velovi[PROTOCOLS[2]]
df_velovi["Method"] = 'VI'

df_em = corr_em[PROTOCOLS[2]]
df_em["Method"] = 'EM'

df_steady_state = corr_steady_state[PROTOCOLS[2]]
df_steady_state["Method"] = 'Steady-state'

combined_corr[PROTOCOLS[2]] = pd.concat([df_velovi, df_em, df_steady_state])

fig, ax = plt.subplots(ncols=combined_corr[PROTOCOLS[2]].shape[1] - 1, figsize=((combined_corr[PROTOCOLS[2]].shape[1] - 1) * 6, 4))
for col_id, col in enumerate(combined_corr[PROTOCOLS[2]].columns[:-1]):
    sns.boxplot(x="Method", y=col, data=combined_corr[PROTOCOLS[2]], palette='colorblind', ax=ax[col_id])
    ax[col_id].set_xticklabels(ax[col_id].get_xticklabels(), rotation=45)

alevin_sep_gtr#
df_velovi = corr_velovi[PROTOCOLS[3]]
df_velovi["Method"] = 'VI'

df_em = corr_em[PROTOCOLS[3]]
df_em["Method"] = 'EM'

df_steady_state = corr_steady_state[PROTOCOLS[3]]
df_steady_state["Method"] = 'Steady-state'

combined_corr[PROTOCOLS[3]] = pd.concat([df_velovi, df_em, df_steady_state])

fig, ax = plt.subplots(ncols=combined_corr[PROTOCOLS[3]].shape[1] - 1, figsize=((combined_corr[PROTOCOLS[3]].shape[1] - 1) * 6, 4))
for col_id, col in enumerate(combined_corr[PROTOCOLS[3]].columns[:-1]):
    sns.boxplot(x="Method", y=col, data=combined_corr[PROTOCOLS[3]], palette='colorblind', ax=ax[col_id])
    ax[col_id].set_xticklabels(ax[col_id].get_xticklabels(), rotation=45)

alevin_spliced_unspliced#
df_velovi = corr_velovi[PROTOCOLS[4]]
df_velovi["Method"] = 'VI'

df_em = corr_em[PROTOCOLS[4]]

df_steady_state = corr_steady_state[PROTOCOLS[4]]
df_steady_state["Method"] = 'Steady-state'

combined_corr[PROTOCOLS[4]] = pd.concat([df_velovi, df_em, df_steady_state])

fig, ax = plt.subplots(ncols=combined_corr[PROTOCOLS[4]].shape[1] - 1, figsize=((combined_corr[PROTOCOLS[4]].shape[1] - 1) * 6, 4))
for col_id, col in enumerate(combined_corr[PROTOCOLS[4]].columns[:-1]):
    sns.boxplot(x="Method", y=col, data=combined_corr[PROTOCOLS[4]], palette='colorblind', ax=ax[col_id])
    ax[col_id].set_xticklabels(ax[col_id].get_xticklabels(), rotation=45)
dropest#
df_velovi = corr_velovi[PROTOCOLS[5]]
df_velovi["Method"] = 'VI'

df_em = corr_em[PROTOCOLS[5]]
df_em["Method"] = 'EM'

df_steady_state = corr_steady_state[PROTOCOLS[5]]
df_steady_state["Method"] = 'Steady-state'

combined_corr[PROTOCOLS[5]] = pd.concat([df_velovi, df_em, df_steady_state])

fig, ax = plt.subplots(ncols=combined_corr[PROTOCOLS[5]].shape[1] - 1, figsize=((combined_corr[PROTOCOLS[5]].shape[1] - 1) * 6, 4))
for col_id, col in enumerate(combined_corr[PROTOCOLS[5]].columns[:-1]):
    sns.boxplot(x="Method", y=col, data=combined_corr[PROTOCOLS[5]], palette='colorblind', ax=ax[col_id])
    ax[col_id].set_xticklabels(ax[col_id].get_xticklabels(), rotation=45)
kallisto_isocollapse_exclude#
df_velovi = corr_velovi[PROTOCOLS[6]]
df_velovi["Method"] = 'VI'

df_em = corr_em[PROTOCOLS[6]]
df_em["Method"] = 'EM'

df_steady_state = corr_steady_state[PROTOCOLS[6]]
df_steady_state["Method"] = 'Steady-state'

combined_corr[PROTOCOLS[6]] = pd.concat([df_velovi, df_em, df_steady_state])

fig, ax = plt.subplots(ncols=combined_corr[PROTOCOLS[6]].shape[1] - 1, figsize=((combined_corr[PROTOCOLS[6]].shape[1] - 1) * 6, 4))
for col_id, col in enumerate(combined_corr[PROTOCOLS[6]].columns[:-1]):
    sns.boxplot(x="Method", y=col, data=combined_corr[PROTOCOLS[6]], palette='colorblind', ax=ax[col_id])
    ax[col_id].set_xticklabels(ax[col_id].get_xticklabels(), rotation=45)
kallisto_isocollapse_include#
df_velovi = corr_velovi[PROTOCOLS[7]]
df_velovi["Method"] = 'VI'

df_em = corr_em[PROTOCOLS[7]]
df_em["Method"] = 'EM'

df_steady_state = corr_steady_state[PROTOCOLS[7]]
df_steady_state["Method"] = 'Steady-state'

combined_corr[PROTOCOLS[7]] = pd.concat([df_velovi, df_em, df_steady_state])

fig, ax = plt.subplots(ncols=combined_corr[PROTOCOLS[7]].shape[1] - 1, figsize=((combined_corr[PROTOCOLS[7]].shape[1] - 1) * 6, 4))
for col_id, col in enumerate(combined_corr[PROTOCOLS[7]].columns[:-1]):
    sns.boxplot(x="Method", y=col, data=combined_corr[PROTOCOLS[7]], palette='colorblind', ax=ax[col_id])
    ax[col_id].set_xticklabels(ax[col_id].get_xticklabels(), rotation=45)
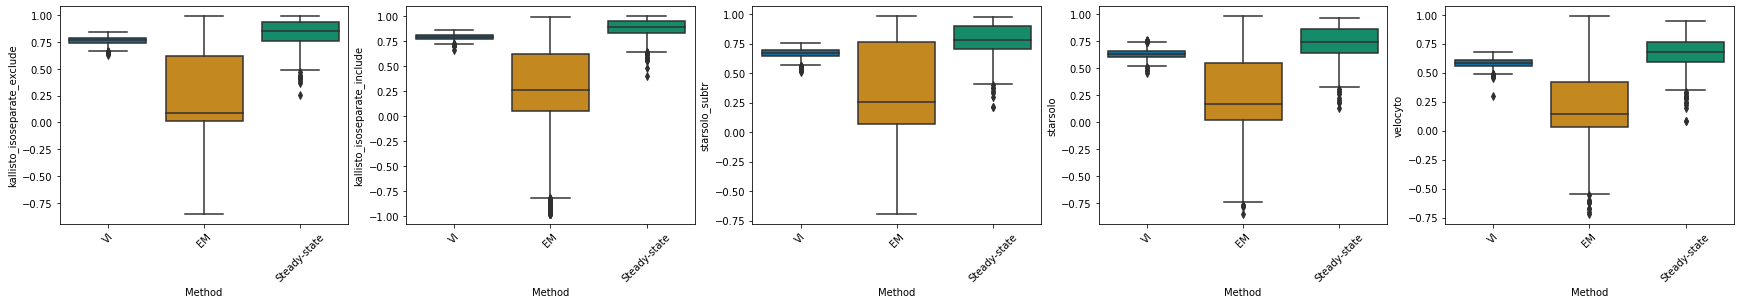
kallisto_isoseparate_exclude#
df_velovi = corr_velovi[PROTOCOLS[8]]
df_velovi["Method"] = 'VI'

df_em = corr_em[PROTOCOLS[8]]
df_em["Method"] = 'EM'

df_steady_state = corr_steady_state[PROTOCOLS[8]]
df_steady_state["Method"] = 'Steady-state'

combined_corr[PROTOCOLS[8]] = pd.concat([df_velovi, df_em, df_steady_state])

fig, ax = plt.subplots(ncols=combined_corr[PROTOCOLS[8]].shape[1] - 1, figsize=((combined_corr[PROTOCOLS[8]].shape[1] - 1) * 6, 4))
for col_id, col in enumerate(combined_corr[PROTOCOLS[8]].columns[:-1]):
    sns.boxplot(x="Method", y=col, data=combined_corr[PROTOCOLS[8]], palette='colorblind', ax=ax[col_id])
    ax[col_id].set_xticklabels(ax[col_id].get_xticklabels(), rotation=45)
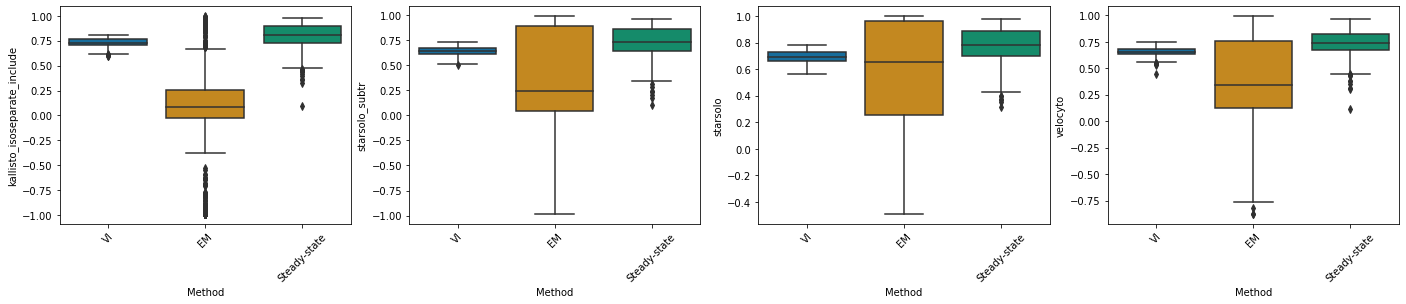
kallisto_isoseparate_include#
df_velovi = corr_velovi[PROTOCOLS[9]]
df_velovi["Method"] = 'VI'

df_em = corr_em[PROTOCOLS[9]]
df_em["Method"] = 'EM'

df_steady_state = corr_steady_state[PROTOCOLS[9]]
df_steady_state["Method"] = 'Steady-state'

combined_corr[PROTOCOLS[9]] = pd.concat([df_velovi, df_em, df_steady_state])

fig, ax = plt.subplots(ncols=combined_corr[PROTOCOLS[9]].shape[1] - 1, figsize=((combined_corr[PROTOCOLS[9]].shape[1] - 1) * 6, 4))
for col_id, col in enumerate(combined_corr[PROTOCOLS[9]].columns[:-1]):
    sns.boxplot(x="Method", y=col, data=combined_corr[PROTOCOLS[9]], palette='colorblind', ax=ax[col_id])
    ax[col_id].set_xticklabels(ax[col_id].get_xticklabels(), rotation=45)
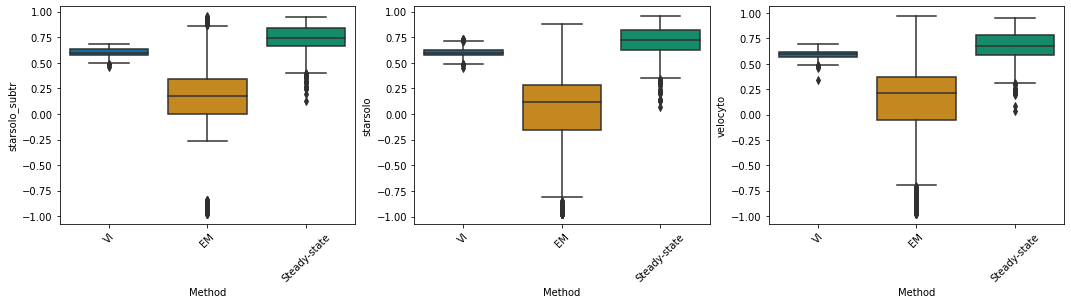
starsolo_subtr#
df_velovi = corr_velovi[PROTOCOLS[10]]
df_velovi["Method"] = 'VI'

df_em = corr_em[PROTOCOLS[10]]
df_em["Method"] = 'EM'

df_steady_state = corr_steady_state[PROTOCOLS[10]]
df_steady_state["Method"] = 'Steady-state'

combined_corr[PROTOCOLS[10]] = pd.concat([df_velovi, df_em, df_steady_state])

fig, ax = plt.subplots(ncols=combined_corr[PROTOCOLS[10]].shape[1] - 1, figsize=((combined_corr[PROTOCOLS[10]].shape[1] - 1) * 6, 4))
for col_id, col in enumerate(combined_corr[PROTOCOLS[10]].columns[:-1]):
    sns.boxplot(x="Method", y=col, data=combined_corr[PROTOCOLS[10]], palette='colorblind', ax=ax[col_id])
    ax[col_id].set_xticklabels(ax[col_id].get_xticklabels(), rotation=45)
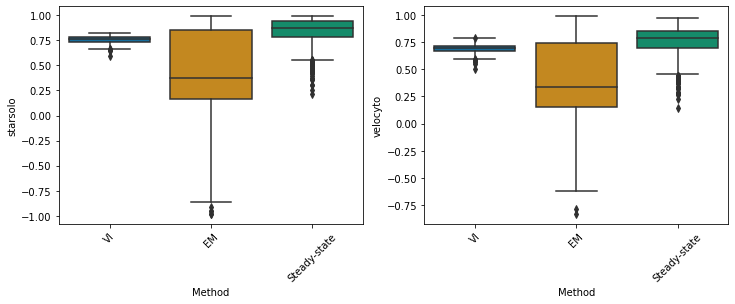
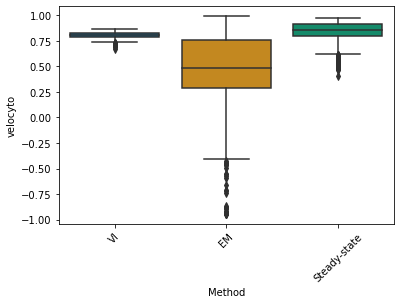
starsolo#
df_velovi = corr_velovi[PROTOCOLS[11]]
df_velovi["Method"] = 'VI'

df_em = corr_em[PROTOCOLS[11]]
df_em["Method"] = 'EM'

df_steady_state = corr_steady_state[PROTOCOLS[11]]
df_steady_state["Method"] = 'Steady-state'

combined_corr[PROTOCOLS[11]] = pd.concat([df_velovi, df_em, df_steady_state])

fig, ax = plt.subplots(ncols=combined_corr[PROTOCOLS[11]].shape[1] - 1, figsize=((combined_corr[PROTOCOLS[11]].shape[1] - 1) * 6, 4))
for col_id, col in enumerate(combined_corr[PROTOCOLS[11]].columns[:-1]):
    sns.boxplot(x="Method", y=col, data=combined_corr[PROTOCOLS[11]], palette='colorblind', ax=ax)
    ax.set_xticklabels(ax.get_xticklabels(), rotation=45)
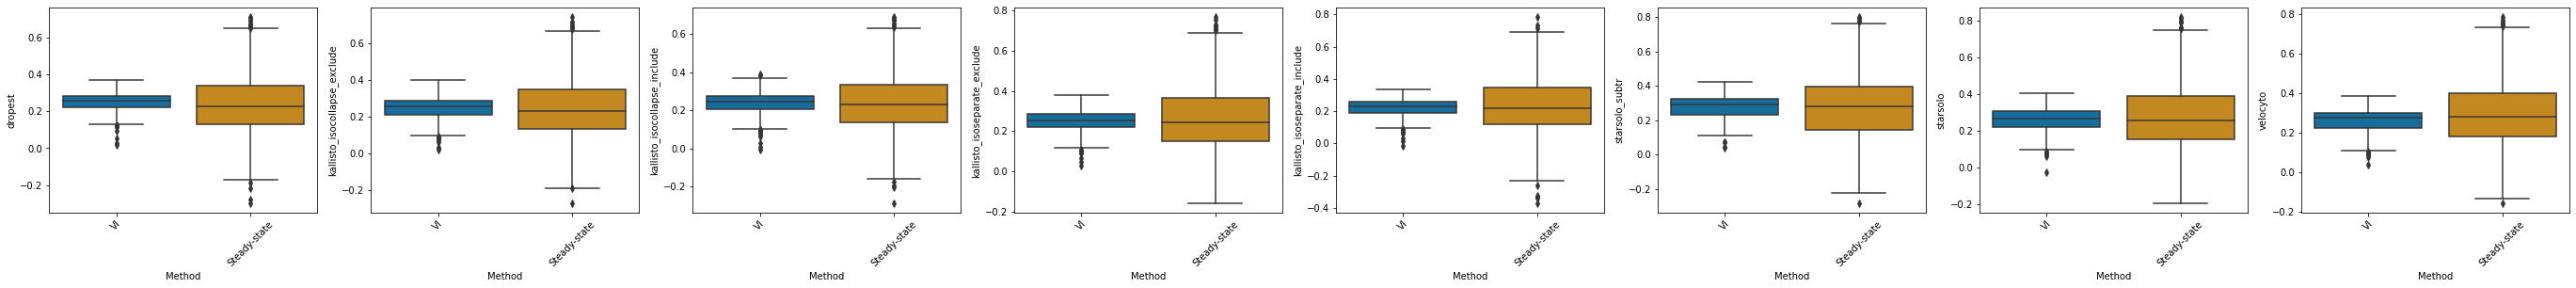
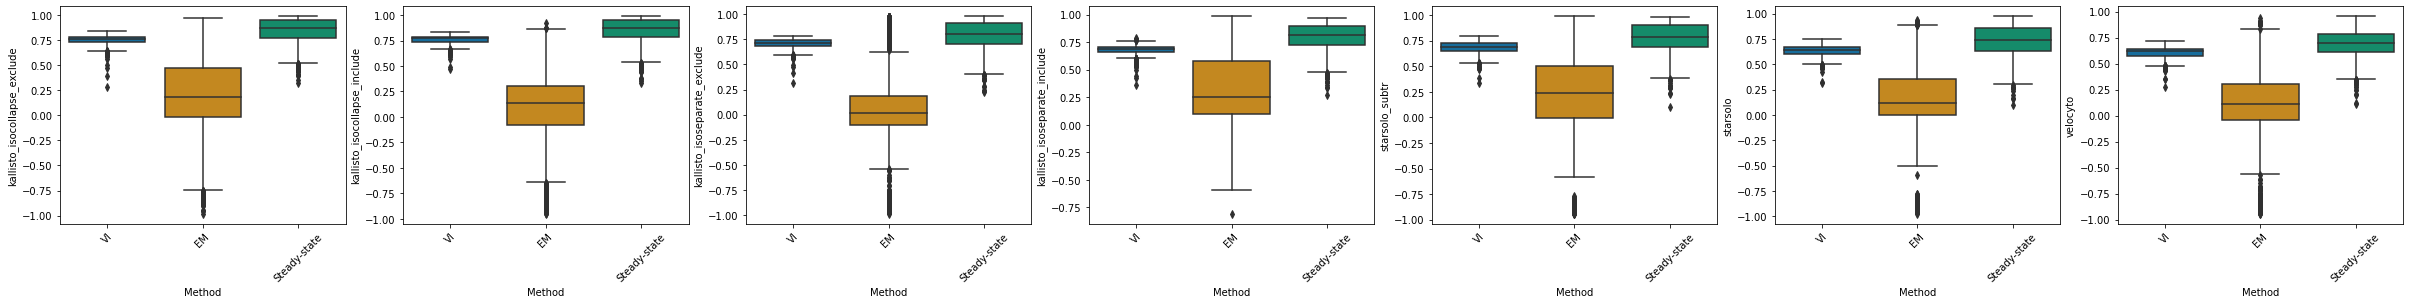
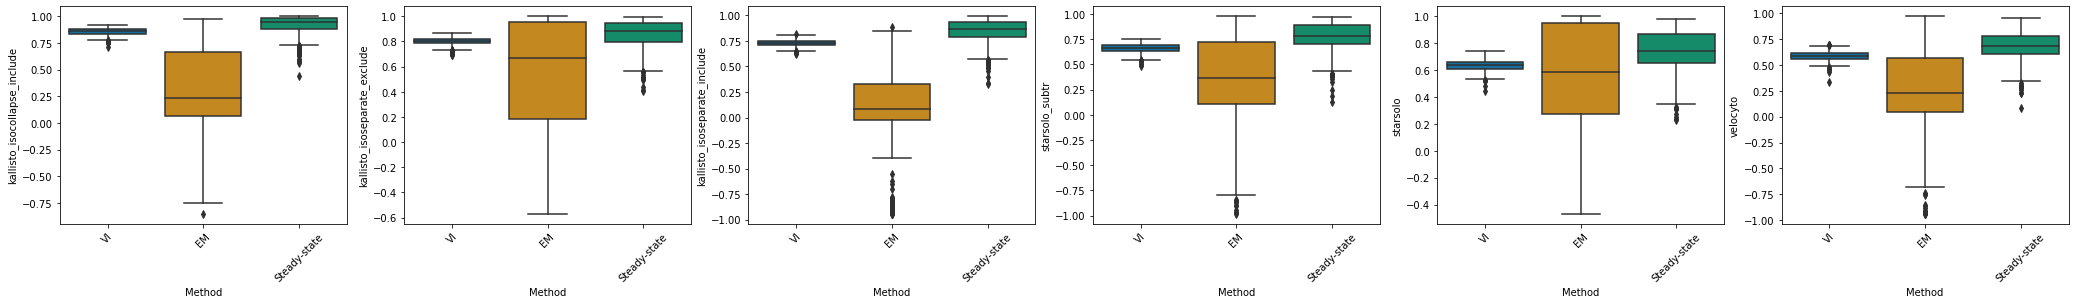
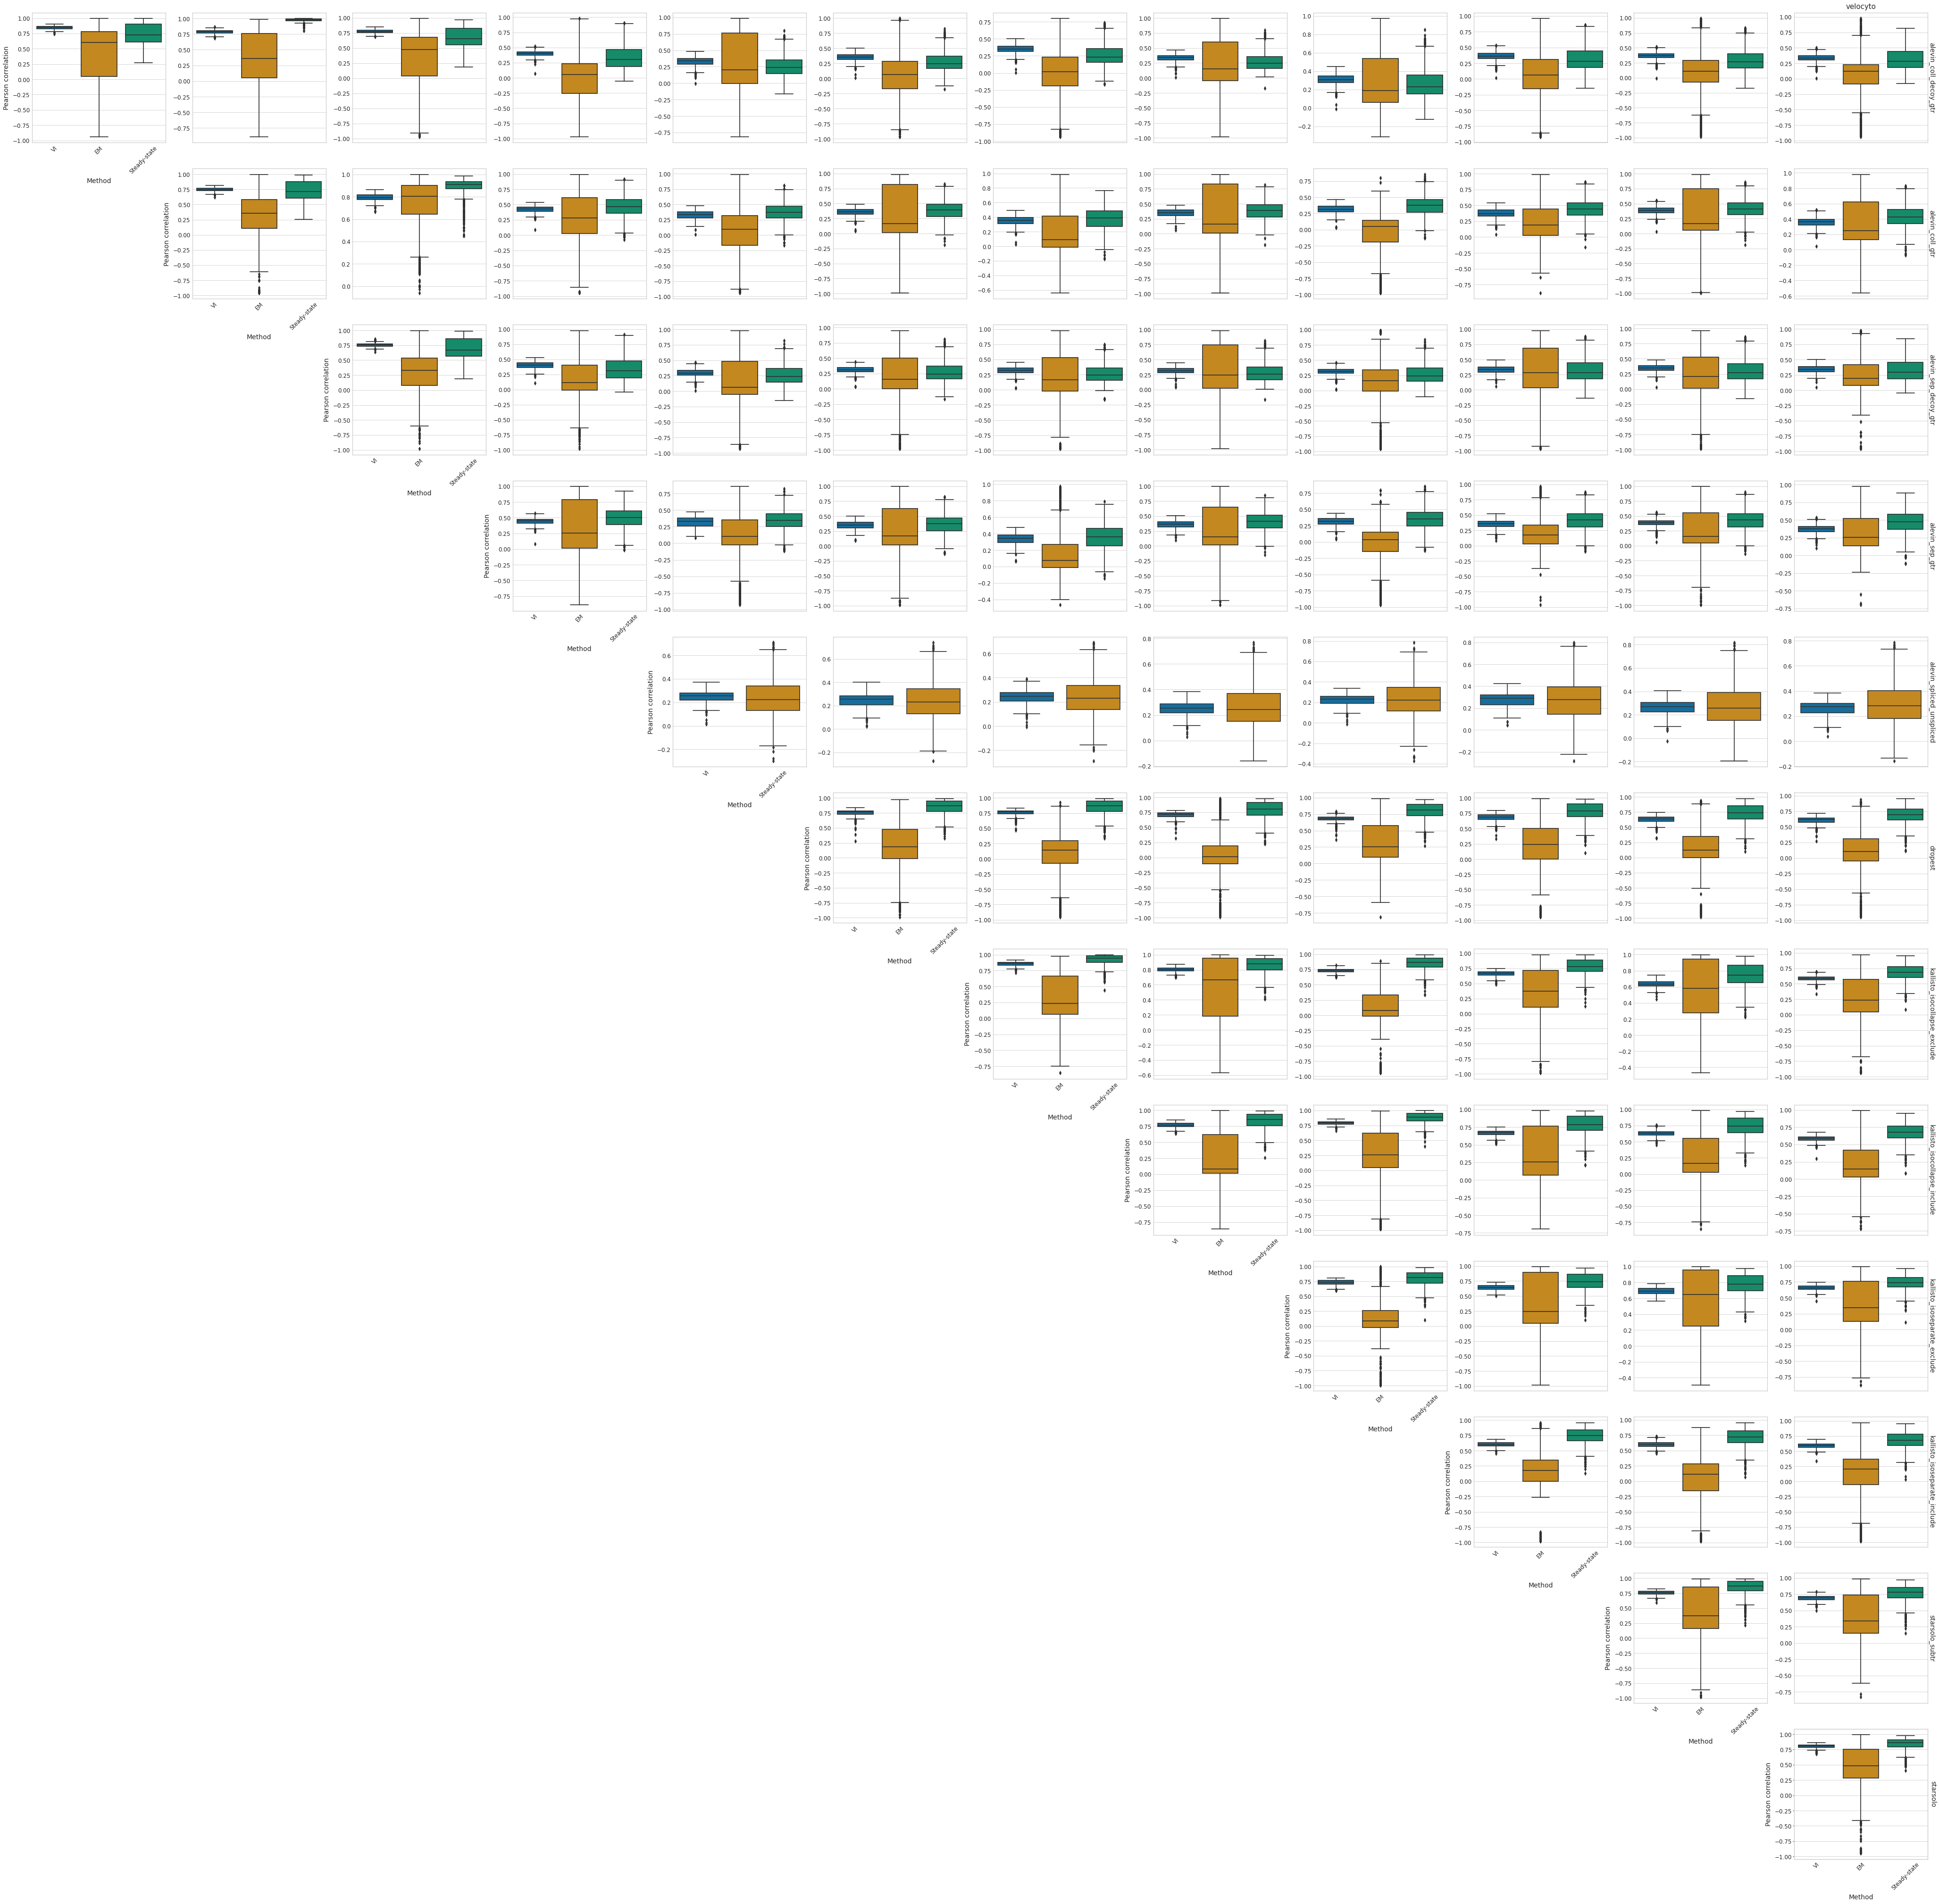
Summary figures#
with mplscience.style_context():
    sns.set_style(style="whitegrid")
    fig, ax = plt.subplots(nrows=len(PROTOCOLS[:-1]), ncols=len(PROTOCOLS[:-1]), figsize=(len(PROTOCOLS[:-1]) * 6, len(PROTOCOLS[:-1]) * 6))
    for row_id, ref_protocol in enumerate(PROTOCOLS[:-1]):
        for col_id, protocol in enumerate(combined_corr[ref_protocol].columns[:-1]):
            df = combined_corr[ref_protocol]

            sns.boxplot(x="Method", y=protocol, data=df, palette='colorblind', ax=ax[row_id, row_id + col_id])
            if col_id == 0:
                ax[row_id, row_id + col_id].set_xticklabels(ax[row_id, row_id + col_id].get_xticklabels(), rotation=45)
            if col_id > 0:
                ax[row_id, row_id + col_id].set_xlabel('')
                ax[row_id, row_id + col_id].set_xticklabels([])
                ax[row_id, row_id + col_id].set_ylabel('')
            ax[row_id, row_id].set_ylabel("Pearson correlation")
        if row_id == 0:
            ax[row_id, row_id + col_id].set_title(protocol)
        if row_id < (len(PROTOCOLS[:-1]) - 1):
            ax[row_id, len(PROTOCOLS[:-1]) - 1].yaxis.set_label_position("right")
            ax[row_id, len(PROTOCOLS[:-1]) - 1].set_ylabel(ref_protocol, rotation=270, labelpad=15)
        else:
            _ax = ax[row_id, row_id].twinx()
            _ax.set_yticks([])
            _ax.yaxis.set_label_position("right")
            _ax.set_ylabel(ref_protocol, rotation=270, labelpad=15)

        for col_id in range(len(PROTOCOLS[:-1])):
            if col_id < row_id:
                ax[row_id, col_id].axis('off')
if SAVE_FIGURES:
    fig.savefig(
        FIG_DIR / 'comparison' / "preprocessing_pfc.pdf",
        bbox_inches="tight",
        dpi=300
    )
    fig.savefig(
        FIG_DIR / 'comparison' / "preprocessing_pfc.svg",
        bbox_inches="tight",
        format='svg'
    );
agg_corr = pd.DataFrame(
combined_corr[PROTOCOLS[0]].iloc[:, :-1].mean(axis=1),
columns=[PROTOCOLS[0]]
)
for ref_protocol in PROTOCOLS[1:-1]:
agg_corr = pd.concat(
[
agg_corr,
pd.DataFrame(
combined_corr[ref_protocol].iloc[:, :-1].mean(axis=1),
columns=[ref_protocol]
)
],
axis=1
)
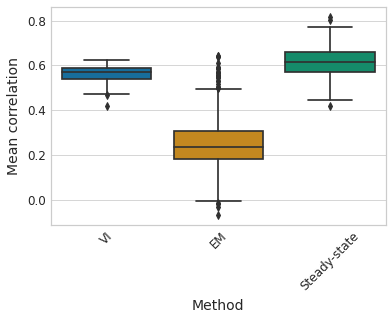
agg_corr = pd.DataFrame(
{
'Mean correlation': agg_corr.mean(axis=1).values,
"Method": combined_corr[PROTOCOLS[0]]["Method"].values
}
)
with mplscience.style_context():
sns.set_style(style="whitegrid")
fig, ax = plt.subplots(figsize=(6, 4))
sns.boxplot(x="Method", y='Mean correlation', data=agg_corr, palette='colorblind', ax=ax);
ax.set_xticklabels(ax.get_xticklabels(), rotation=45);
if SAVE_FIGURES:
fig.savefig(
FIG_DIR / 'comparison' / "preprocessing_pfc_aggregated.pdf",
bbox_inches="tight",
dpi=300
)
fig.savefig(
FIG_DIR / 'comparison' / "preprocessing_pfc_aggregated.svg",
bbox_inches="tight",
format='svg'
);