Comparison of velocities between EM and VI model#
Output
fitted_values.csv: CSV file containing fitted parameters using the EM and VI model.
Library imports#
import os
import sys

import numpy as np
import pandas as pd
import torch
from velovi import preprocess_data, VELOVI

import matplotlib.pyplot as plt
import mplscience
import seaborn as sns

import scanpy as sc
import scvelo as scv
import scvi
from scvelo.plotting.simulation import compute_dynamics

sys.path.append("../..")
from paths import DATA_DIR, FIG_DIR
Global seed set to 0
/home/icb/philipp.weiler/miniconda3/envs/velovi-py39/lib/python3.9/site-packages/pytorch_lightning/utilities/warnings.py:53: LightningDeprecationWarning: pytorch_lightning.utilities.warnings.rank_zero_deprecation has been deprecated in v1.6 and will be removed in v1.8. Use the equivalent function from the pytorch_lightning.utilities.rank_zero module instead.
  new_rank_zero_deprecation(
/home/icb/philipp.weiler/miniconda3/envs/velovi-py39/lib/python3.9/site-packages/pytorch_lightning/utilities/warnings.py:58: LightningDeprecationWarning: The `pytorch_lightning.loggers.base.rank_zero_experiment` is deprecated in v1.7 and will be removed in v1.9. Please use `pytorch_lightning.loggers.logger.rank_zero_experiment` instead.
  return new_rank_zero_deprecation(*args, **kwargs)
General settings#
scvi.settings.dl_pin_memory_gpu_training = False
sns.reset_defaults()
sns.reset_orig()
scv.settings.set_figure_params('scvelo', dpi_save=400, dpi=80, transparent=True, fontsize=20, color_map='viridis')
SAVE_FIGURES = False
if SAVE_FIGURES:
    os.makedirs(FIG_DIR / 'comparison', exist_ok=True)
Function definitions#
def fit_scvelo(adata):
    scv.tl.recover_dynamics(
        adata, fit_scaling=False, var_names=adata.var_names, n_jobs=8
    )
    scv.tl.velocity(adata, mode="dynamical")
def fit_velovi(bdata):
VELOVI.setup_anndata(bdata, spliced_layer="Ms", unspliced_layer="Mu")
vae = VELOVI(bdata)
vae.train()
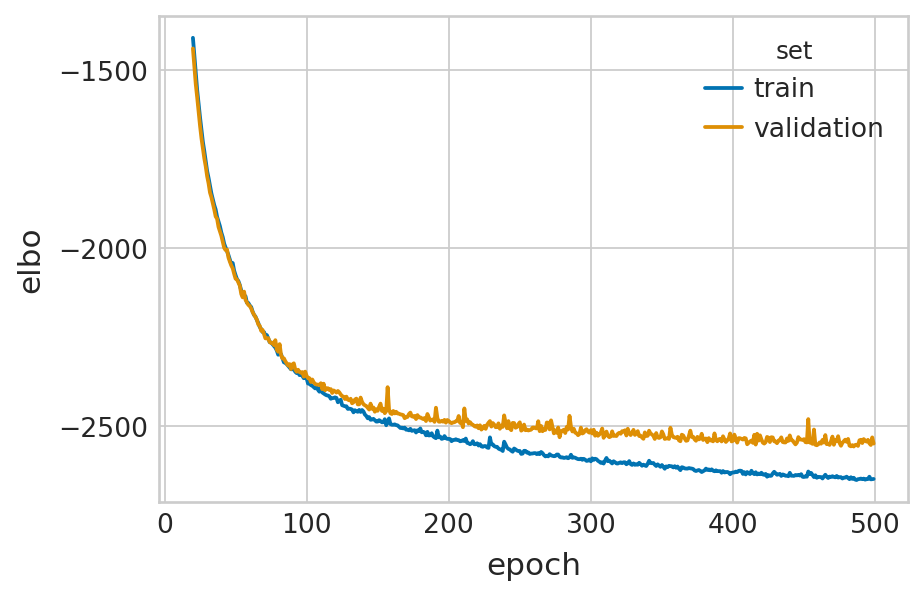
df = vae.history["elbo_train"].iloc[20:].reset_index().rename(columns={'elbo_train': 'elbo'})
df['set'] = 'train'
_df = vae.history["elbo_validation"].iloc[20:].reset_index().rename(columns={'elbo_validation': 'elbo'})
_df['set'] = 'validation'
df = pd.concat([df, _df], axis=0).reset_index(drop=True)
with mplscience.style_context():
sns.set_style(style="whitegrid")
fig, ax = plt.subplots(figsize=(6, 4))
sns.lineplot(data=df, x='epoch', y='elbo', hue='set', palette=['#0173B2', '#DE8F05'], ax=ax)
latent_time = vae.get_latent_time(n_samples=25)
velocities = vae.get_velocity(n_samples=25, velo_statistic="mean")
t = latent_time
scaling = 20 / t.max(0)
bdata.layers["velocities_velovi"] = velocities / scaling
bdata.layers["latent_time_velovi"] = latent_time
bdata.var["fit_alpha"] = vae.get_rates()["alpha"] / scaling
bdata.var["fit_beta"] = vae.get_rates()["beta"] / scaling
bdata.var["fit_gamma"] = vae.get_rates()["gamma"] / scaling
bdata.var["fit_t_"] = (
torch.nn.functional.softplus(vae.module.switch_time_unconstr)
.detach()
.cpu()
.numpy()
) * scaling
bdata.layers["fit_t"] = latent_time.values * scaling[np.newaxis, :]
bdata.var['fit_scaling'] = 1.0
return vae
Data loading#
adata = scv.datasets.pancreas(DATA_DIR / "pancreas" / "endocrinogenesis_day15.h5ad")
adata
AnnData object with n_obs × n_vars = 3696 × 27998
    obs: 'clusters_coarse', 'clusters', 'S_score', 'G2M_score'
    var: 'highly_variable_genes'
    uns: 'clusters_coarse_colors', 'clusters_colors', 'day_colors', 'neighbors', 'pca'
    obsm: 'X_pca', 'X_umap'
    layers: 'spliced', 'unspliced'
    obsp: 'distances', 'connectivities'
palette = dict(zip(adata.obs['clusters'].cat.categories, adata.uns['clusters_colors']))
Data preprocessing#
scv.pp.filter_and_normalize(adata, min_shared_counts=20, n_top_genes=2000)
scv.pp.moments(adata, n_pcs=30, n_neighbors=30)
adata = preprocess_data(adata)

bdata = adata.copy()
Filtered out 20801 genes that are detected 20 counts (shared).
Normalized count data: X, spliced, unspliced.
Extracted 2000 highly variable genes.
Logarithmized X.
computing neighbors
    finished (0:00:13) --> added
    'distances' and 'connectivities', weighted adjacency matrices (adata.obsp)
computing moments based on connectivities
    finished (0:00:00) --> added
    'Ms' and 'Mu', moments of un/spliced abundances (adata.layers)
computing velocities
    finished (0:00:00) --> added
    'velocity', velocity vectors for each individual cell (adata.layers)
Model fitting#
adata = sc.read(DATA_DIR / 'pancreas' / 'adata_after_scvelo_pipeline.h5ad')
velovi_vae = fit_velovi(bdata)
GPU available: True (cuda), used: True
TPU available: False, using: 0 TPU cores
IPU available: False, using: 0 IPUs
HPU available: False, using: 0 HPUs
LOCAL_RANK: 0 - CUDA_VISIBLE_DEVICES: [0]
Epoch 500/500: 100%|██████████| 500/500 [03:30<00:00, 2.83it/s, loss=-2.65e+03, v_num=1]
`Trainer.fit` stopped: `max_epochs=500` reached.
Epoch 500/500: 100%|██████████| 500/500 [03:30<00:00, 2.37it/s, loss=-2.65e+03, v_num=1]
rates_em_model = adata.var[['fit_alpha', 'fit_beta', 'fit_gamma', 'fit_t_']]
rates_em_model['model'] = 'EM'
rates_vi_model = bdata.var[['fit_alpha', 'fit_beta', 'fit_gamma', 'fit_t_']]
rates_vi_model['model'] = 'VI'

pd.concat([rates_em_model, rates_vi_model]).to_csv(DATA_DIR / "pancreas" / "fitted_values.csv")
Evaluate#
Gene comparison#
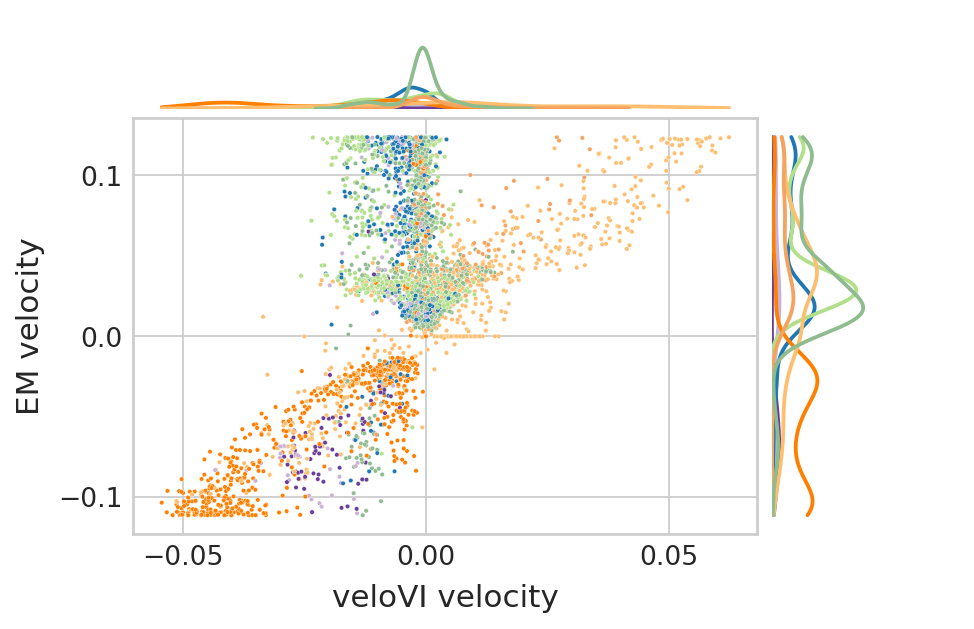
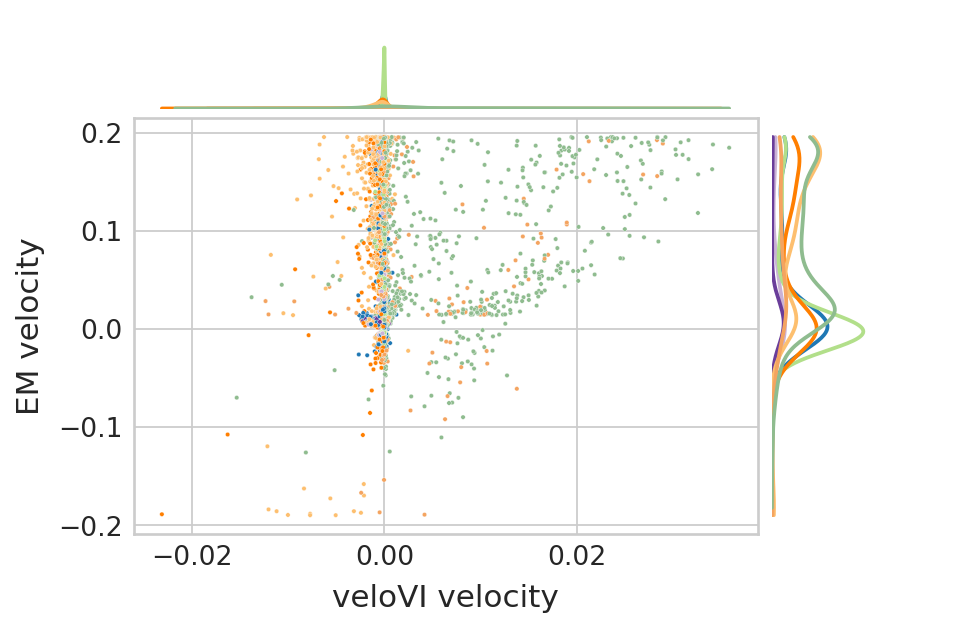
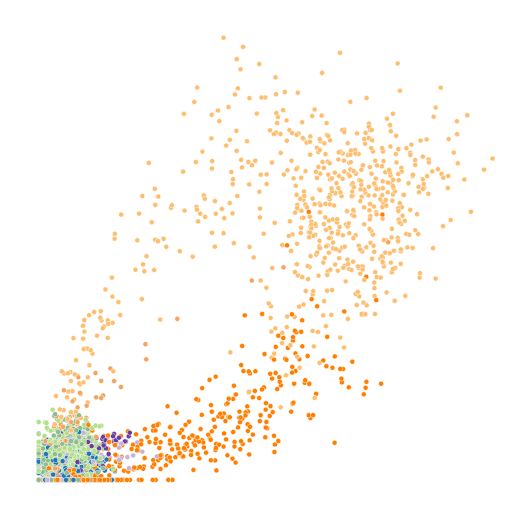
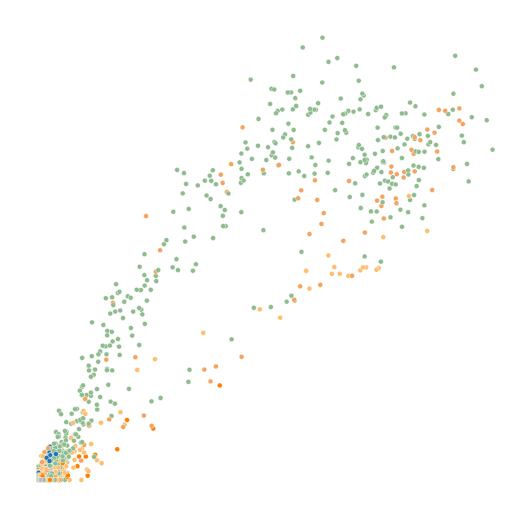
genes = ['Sulf2', 'Top2a']

for gene in genes:
    print(f"Correlation {gene}: {np.corrcoef(adata.to_df('velocity')[gene], bdata.to_df('velocities_velovi')[gene])[0, 1]}")
Correlation Sulf2: 0.6004494854557519
Correlation Top2a: 0.1308248586326778
for gene in genes:
    with mplscience.style_context():
        fig, ax = plt.subplots(figsize=(4, 4))

        df = pd.DataFrame()
        df["Unspliced"] = adata.to_df("Mu")[gene]
        df["Spliced"] = bdata.to_df("Ms")[gene]
        df["clusters"] = adata.obs.clusters
        sns.scatterplot(
            x="Spliced",
            y="Unspliced",
            data=df,
            hue="clusters",
            s=5,
            ax=ax,
            palette=palette,
        );

        ax.axis('off')
        ax.get_legend().remove()

    if SAVE_FIGURES:
        fig.savefig(
            FIG_DIR / 'comparison' / f'phase_portrait_pancreas_{gene}.svg',
            format="svg",
            transparent=True,
            bbox_inches='tight'
        )
for gene in genes:
    with mplscience.style_context():
        sns.set_style(style="whitegrid")
        fig, ax = plt.subplots(figsize=(6, 4))
        ax.axis('off')
        left, width = 0.1, 0.65
        bottom, height = 0.1, 0.65
        spacing = 0.015
        rect_scatter = [left, bottom, width, height]
        rect_histx = [left, bottom + height + spacing, width, 0.1]
        rect_histy = [left + width + spacing, bottom, 0.1, height]

        ax = fig.add_axes(rect_scatter)
        ax_histx = fig.add_axes(rect_histx, sharex=ax)
        ax_histy = fig.add_axes(rect_histy, sharey=ax)
        ax_histx.axis("off")
        ax_histy.axis("off")

        df = pd.DataFrame()
        df["EM velocity"] = adata.to_df("velocity")[gene]
        df["veloVI velocity"] = bdata.to_df("velocities_velovi")[gene]
        df["clusters"] = adata.obs.clusters
        clipy = (df["EM velocity"].min(), df["EM velocity"].max())
        clipx = (df["veloVI velocity"].min(), df["veloVI velocity"].max())
        sns.kdeplot(
            data=df,
            y="EM velocity",
            hue="clusters",
            ax=ax_histy,
            legend=False,
            clip=clipy,
            palette=palette,
        )
        sns.kdeplot(
            data=df,
            x="veloVI velocity",
            hue="clusters",
            ax=ax_histx,
            legend=False,
            clip=clipx,
            palette=palette,
        )
        sns.scatterplot(
            y="EM velocity",
            x="veloVI velocity",
            data=df,
            hue="clusters",
            s=4,
            palette=palette,
            ax=ax,
            legend=False
        )


    if SAVE_FIGURES:
        fig.savefig(
            FIG_DIR / 'comparison' / f'velocity_comparison_pancreas_{gene}.svg',
            format="svg",
            transparent=True,
            bbox_inches='tight'
        )