Note
This page was generated from
notebooks\Demo.ipynb.
Interactive online version:
![]() .
.
Compass Analysis
This notebook gives a small demo of analyzing the results of the compass algorithm and replicates figures 2E and 2C from the paper.
To install the required python packages, you can uncomment the “install_reqs()” call.
[1]:
def install_reqs():
  !pip install pandas
  !pip install "matplotlib>=3.4"
  !pip install numpy
  !pip install statsmodels
  !pip install scipy
#install_reqs()
[2]:
import sys
if "google.colab" in sys.modules:
  !git clone -b docs https://github.com/YosefLab/Compass.git --depth 1
  !cp -r Compass/notebooks/extdata ./
  !cp /content/Compass/notebooks/compass_analysis.py /content/compass_analysis.py
  !rm -r /content/Compass
  install_reqs()
[3]:
import pandas as pd
import numpy as np
import matplotlib.pyplot as plt
from compass_analysis import cohens_d, wilcoxon_test, get_reaction_consistencies, get_metareactions, labeled_reactions, amino_acid_metab
[4]:
from matplotlib import __version__ as matplotlibversion
if matplotlibversion < "3.4":
    print("Matplotlib versions older than 3.4 may not be able to generate figure 2E, as they do not support alpha arrays")
The file “extdata/Th17/reactions.tsv” is the outputs of a compass run and “extdata/Th17/cell_metadata.csv” is cell metadata, in this case it is only used to know the condition of the Th17 cells (pathogenic vs. non-pathogenic). Commented out are alternative files to use for a microcpooled example.
[5]:
reaction_penalties = pd.read_csv("extdata/Th17/reactions.tsv", sep="\t", index_col = 0)
#reaction_penalties = pd.read_csv("extdata/Th17-micropooled/reactions.tsv", sep="\t", index_col = 0)
[6]:
cell_metadata = pd.read_csv("extdata/Th17/cell_metadata.csv", index_col = 0)
#cell_metadata = pd.read_csv("extdata/Th17-micropooled/cluster_metadata.csv", index_col = 0)
[7]:
# pathogenic Th17 = Th17p; non-pathogenic Th17 = Th17n

Th17p_cells = cell_metadata.index[cell_metadata['cell_type'] == 'Th17p']
Th17n_cells = cell_metadata.index[cell_metadata['cell_type'] == 'Th17n']
The reaction metadata for RECON2 is stored here. We’ll be using the confidence scores and the subsystem groupings to filter out reactions and group them for analysis.
[8]:
reaction_metadata = pd.read_csv("extdata/RECON2/reaction_metadata.csv", index_col = 0)
Here is one example of a row for the reaction metadata:
[9]:
reaction_metadata.loc[['r0281']]
[9]:
| reaction_name | formula | associated_genes | subsystem | EC_number | confidence | |
|---|---|---|---|---|---|---|
| reaction_no_direction | ||||||
| r0281 | Putrescine:oxygen oxidoreductase (deaminating)... | 1.00 * Water [e] + 1.00 * O2 [e] + 1.00 * Putr... | AOC1 | Methionine and cysteine metabolism | 1.4.3.6 | 0.0 |
The numbers in the reactions tsv correspond to penalties for each reaction per cell, so we take the negative log to get scores that are higher the more active the reaction is predicted to be. This also drops reactions that are close to constant and therefore not informative for the comparison.
[10]:
#This function is repeated here for clarity
def get_reaction_consistencies(compass_reaction_penalties, min_range=1e-3):
    """
        Converts the raw penalties outputs of compass into scores per reactions where higher numbers indicate more activity
    """
    df = -np.log(compass_reaction_penalties + 1)
    df = df[df.max(axis=1) - df.min(axis=1) >= min_range]
    df = df - df.min().min()
    return df
[11]:
reaction_consistencies = get_reaction_consistencies(reaction_penalties)
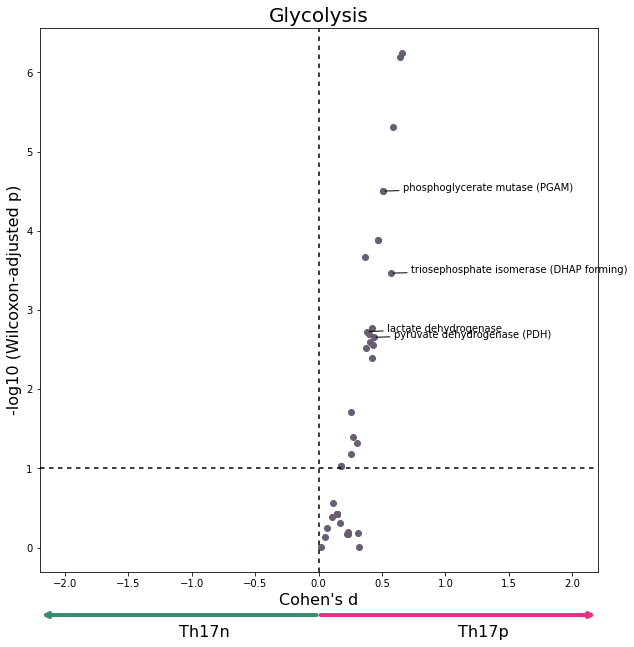
We use the unpaired Wilcoxon rank-sum test (equivlanet to the Mann–Whitney U test) to analyze which reactions are predicted to be more active in pathogenic Th17p cells compared to the non-pathogenic Th17n cells. Positive values indicate higher potential activity in Th17p.
[12]:
wilcox_results = wilcoxon_test(reaction_consistencies, Th17p_cells, Th17n_cells)
wilcox_results['metadata_r_id'] = ""
for r in wilcox_results.index:
    if r in reaction_metadata.index:
        wilcox_results.loc[r, 'metadata_r_id'] = r
    elif r[:-4] in reaction_metadata.index:
        wilcox_results.loc[r, 'metadata_r_id'] = r[:-4]
    else:
        print("Should not occur")
Next we join the metadata to the reactions in a new dataframe W, so that we can filter out non-core reactions. More specifically, we remove reactions with confidence other than 0 or 4 (4 = most confident; 0 = unassigned confidence) and filter out reactions in the citric acid cycle subsystem which are outside of the mitochondria.
[13]:
W = wilcox_results.merge(reaction_metadata, how='left',
                         left_on='metadata_r_id', right_index=True, validate='m:1')
W = W[W['confidence'].isin([0,4])]
W = W[~W['EC_number'].isna()]
W.loc[(W['formula'].map(lambda x: '[m]' not in x)) & (W['subsystem'] == "Citric acid cycle"), 'subsystem'] = 'Other'
Here is one example of a row of the reuslting dataframe for a reaction:
[14]:
wilcox_results.loc[['r0281_pos']]
[14]:
| wilcox_stat | wilcox_pval | cohens_d | adjusted_pval | metadata_r_id | |
|---|---|---|---|---|---|
| r0281_pos | 9269.0 | 0.085969 | -0.221507 | 0.153125 | r0281 |
The “_neg” or “_pos” suffixes indicate one direction of a bidirectional reaction. The “_pos” direction indicates positive flux through the reaction. For this example reaction it indicates water, oxygen, and putrescine are being consumed by this reaction to produce ammonium, hyrodgen peroxide, and 4-Aminobutanal.
[15]:
reaction_metadata.loc['r0281']['formula']
[15]:
'1.00 * Water [e] + 1.00 * O2 [e] + 1.00 * Putrescine [e] --> 1.00 * Ammonium [e] + 1.00 * Hydrogen peroxide [e] + 1.00 * 4-Aminobutanal [e]\r\nAOC1'
Optional: Metareaction analysis
Metareactions are used in the paper rather than single reaction analysis and the section at the bottom of this notebook performs the same analysis using reactions clustered into metareactions.
Figure 2C replication
[16]:
def plot_differential_scores(data, title, c):
    plt.figure(figsize=(10,10))
    axs = plt.gca()
    axs.scatter(data['cohens_d'], -np.log10(data['adjusted_pval']), c=c)
    axs.set_xlabel("Cohen's d", fontsize=16)
    axs.set_ylabel("-log10 (Wilcoxon-adjusted p)", fontsize=16)
    #Everything after this should be tweaked depending on your application
    axs.set_xlim(-2.2, 2.2)
    axs.axvline(0, dashes=(3,3), c='black')
    axs.axhline(1, dashes=(3,3), c='black')
    axs.set_title(title, fontdict={'fontsize':20})
    axs.annotate('', xy=(0.5, -0.08), xycoords='axes fraction', xytext=(0, -0.08),
            arrowprops=dict(arrowstyle="<-", color='#348C73', linewidth=4))
    axs.annotate('Th17p', xy=(0.75, -0.12), xycoords='axes fraction', fontsize=16)
    axs.annotate('', xy=(0.5, -0.08), xycoords='axes fraction', xytext=(1, -0.08),
            arrowprops=dict(arrowstyle="<-", color='#E92E87', linewidth=4))
    axs.annotate('Th17n', xy=(0.25, -0.12), xycoords='axes fraction', fontsize=16)
    for r in data.index:
        if r in labeled_reactions:
            x = data.loc[r, 'cohens_d']
            y = -np.log10(data.loc[r, 'adjusted_pval'])
            offset = (20, 0)
            if x < 0:
                offset = (-100, -40)
            axs.annotate(labeled_reactions[r], (x,y), xytext = offset,
                         textcoords='offset pixels', arrowprops={'arrowstyle':"-"})
[17]:
filtered_data = pd.concat([W[W['subsystem'] == "Glycolysis/gluconeogenesis"],
             W[W['subsystem'] == "Citric acid cycle"],
            W[W['subsystem'].isin(amino_acid_metab)],
           W[W['subsystem'] == "Fatty acid oxidation"]])
[18]:
data = W[W['subsystem'] == "Glycolysis/gluconeogenesis"]
plot_differential_scores(data, title='Glycolysis', c="#695D73")
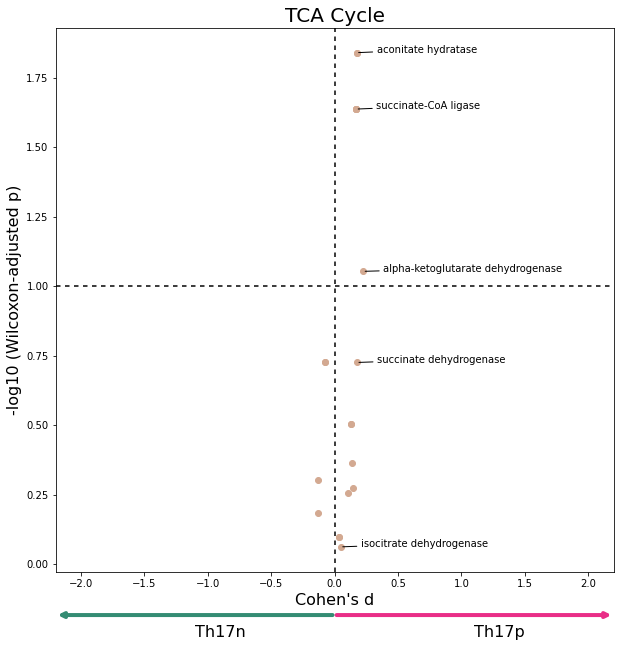
[19]:
data = W[W['subsystem'] == "Citric acid cycle"]
plot_differential_scores(data, title="TCA Cycle", c="#D3A991")
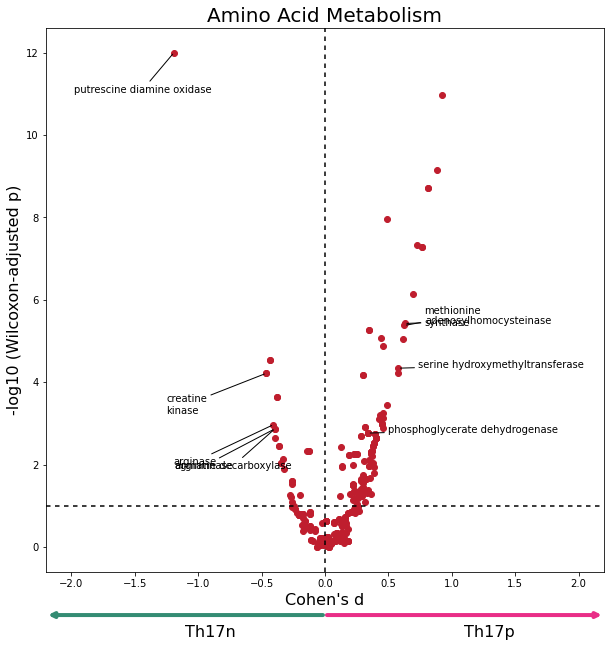
[20]:
data = W[W['subsystem'].isin(amino_acid_metab)].copy()
data['adjusted_pval'] = data['adjusted_pval'].clip(1e-12)
plot_differential_scores(data, "Amino Acid Metabolism", c="#BF1E2E")
[21]:
data = W[W['subsystem'] == "Fatty acid oxidation"]
plot_differential_scores(data, "Fatty Acid Oxidation", c="#040772")

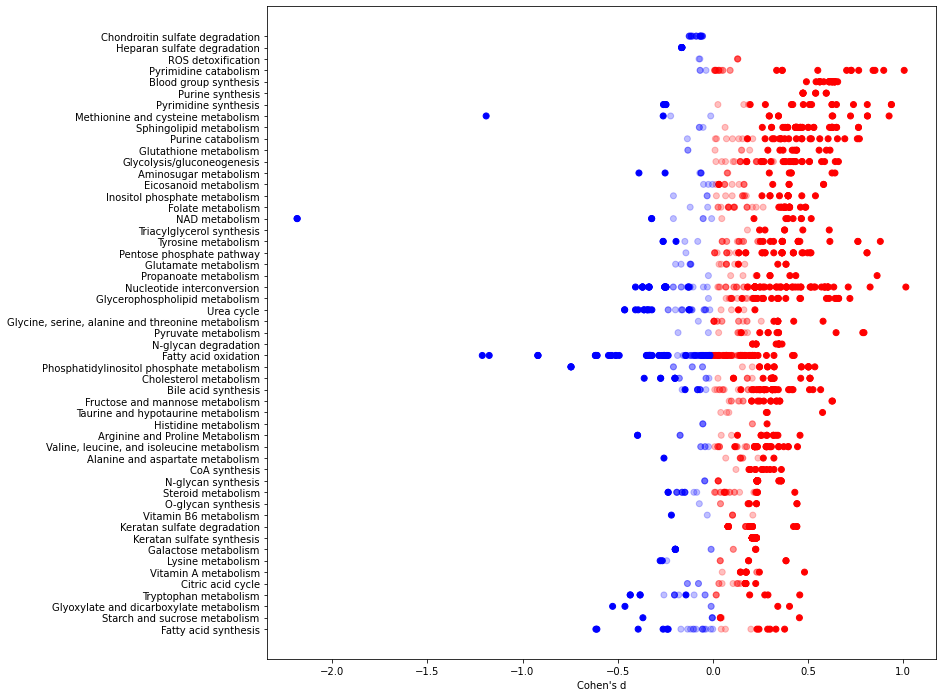
Figure 2E replication
[22]:
data = W[~W['subsystem'].isin(["Miscellaneous", "Unassigned"])]
data = data[~data['subsystem'].map(lambda x: "Transport" in x or "Exchange" in x or x == "Other")]
items, counts = np.unique(data['subsystem'], return_counts=True)
items = [items[i] for i in range(len(items)) if counts[i] > 5] #filter(n() > 5) %>%
data = data[data['subsystem'].isin(items)]
[23]:
plt.figure(figsize=(12,12))
axs = plt.gca()
#Sorts the reactions for plotting
d = data[data['adjusted_pval'] < 0.1].groupby('subsystem')['cohens_d'].median().abs()
axs.scatter(d[d.argsort], d[d.argsort].index, alpha=0)
color = data['cohens_d'].map(lambda x: 'r' if x >= 0 else 'b')
alpha = data['adjusted_pval'].map(lambda x: 1.0 if x < 0.1 else 0.25)
axs.scatter(data['cohens_d'], data['subsystem'], c=color, alpha=alpha)
axs.set_xlabel("Cohen's d")
[23]:
Text(0.5, 0, "Cohen's d")
Metareactions
The following section analyzes the the results by clustering the reactions into metareactions, matching with the manuscript as closely as possible (upto Python vs R). It will be repeating the previous analysis for the clustered reactions instead of single reactions.
[24]:
reaction_penalties = pd.read_csv("extdata/Th17/reactions.tsv", sep="\t", index_col = 0)
#reaction_penalties = pd.read_csv("extdata/Th17-micropooled/reactions.tsv", sep="\t", index_col = 0)
reaction_penalties[reaction_penalties <= 1e-4] = 0
reaction_penalties = reaction_penalties[np.all(reaction_penalties != 0, axis=1)]
[25]:
reaction_penalties = reaction_penalties[reaction_penalties.max(axis=1) - reaction_penalties.min(axis=1) != 0]
We group reactions into metareactions using heirarchical clustering as detailed in the manuscript.
[26]:
meta_rxns_map = get_metareactions(reaction_penalties)
meta_rxns = reaction_penalties.join(pd.DataFrame(meta_rxns_map, columns=["meta_rxn_id"], index = reaction_penalties.index)).groupby("meta_rxn_id").mean()
[27]:
meta_rxn_consistencies = get_reaction_consistencies(meta_rxns)
[28]:
wilcox_meta_rxn_results = wilcoxon_test(meta_rxn_consistencies, Th17p_cells, Th17n_cells)
Now each row of the dataframe contains the results of the statistical tests for each metareaction:
[29]:
wilcox_meta_rxn_results.iloc[0:1]
[29]:
| wilcox_stat | wilcox_pval | cohens_d | adjusted_pval | |
|---|---|---|---|---|
| meta_rxn_id | ||||
| 1 | 4172.0 | 7.900994e-19 | -1.261458 | 1.360551e-16 |
Next the metareaction results dataframe is expanded out to each reaction that makes up the metareactions so that the metadata can be joined to it and used to generate plots.
[30]:
wilcox_meta_rxn_expanded = pd.DataFrame(index=reaction_penalties.index, columns=wilcox_meta_rxn_results.columns)
for i in range(len(wilcox_meta_rxn_expanded.index)):
    if (meta_rxns_map[i] in wilcox_meta_rxn_results.index):
        wilcox_meta_rxn_expanded.loc[wilcox_meta_rxn_expanded.index[i]] = wilcox_meta_rxn_results.loc[meta_rxns_map[i]]
wilcox_meta_rxn_expanded = wilcox_meta_rxn_expanded.dropna().astype('float64')
[31]:
wilcox_meta_rxn_expanded['metadata_r_id'] = ""
for r in wilcox_meta_rxn_expanded.index:
    if r in reaction_metadata.index:
        wilcox_meta_rxn_expanded.loc[r, 'metadata_r_id'] = r
    elif r[:-4] in reaction_metadata.index:
        wilcox_meta_rxn_expanded.loc[r, 'metadata_r_id'] = r[:-4]
    else:
        print("Should not occur")
Now each row contains information on a single reaction:
[32]:
wilcox_meta_rxn_expanded.iloc[0:1]
[32]:
| wilcox_stat | wilcox_pval | cohens_d | adjusted_pval | metadata_r_id | |
|---|---|---|---|---|---|
| 10FTHF5GLUtl_pos | 12939.0 | 0.000613 | 0.390921 | 0.002207 | 10FTHF5GLUtl |
To generate the following figures with the metareactions, simply uncomment the cell below and run it. Then you can generate the figures with the previous cells for Figure 2C replication and Figure 2E replication using the metareaction based data.
[33]:
#W = wilcox_meta_rxn_expanded.merge(reaction_metadata, how='left',
#                         left_on='metadata_r_id', right_index=True, validate='m:1')
#W = W[W['confidence'].isin([0,4])]
#W = W[~W['EC_number'].isna()]
#W.loc[(W['formula'].map(lambda x: '[m]' not in x)) & (W['subsystem'] == "Citric acid cycle"), 'subsystem'] = 'Other'